For years, the single greatest barrier to electric vehicle adoption in the United Kingdom has been a pervasive, financially paralysing fear: the anxiety that the battery is a ticking time bomb. Prospective buyers envision a catastrophic failure moment just as the warranty expires, requiring a replacement cost equivalent to a deposit on a house. However, data from leading automotive engineers and battery specialists regarding 2026 model architectures suggests this anxiety is not only outdated but fundamentally scientifically flawed.
The assumption that an electric drivetrain shares the fragility of a consumer smartphone battery is a costly misconception preventing millions from making the switch. Recent longevity studies on high-capacity cells—specifically regarding Tesla Battery Life and upcoming solid-state hybrids—indicate a lifespan that doesn’t just rival internal combustion engines (ICE) but frequently outlasts the chassis of the car itself. The secret lies in a radical shift in cathode chemistry and thermal management that most drivers remain completely unaware of, yet it changes the ownership equation entirely.
The Degradation Curve: Why Your Fear is Mathematics, Not Chemistry
The prevailing myth suggests a linear path to destruction, where a battery loses capacity as rapidly as a mobile phone. In reality, modern EV batteries follow a ‘knee’ curve which is significantly shallower than anticipated. Data from fleets with over 200,000 miles on the clock shows that after an initial calibration drop, degradation stabilises remarkably.
When analysing the lifespan of a modern electric vehicle compared to a traditional petrol or diesel car, the economic argument shifts drastically when looking at the ‘Total Cost of Ownership’ (TCO) over a decade.
Table 1: The Expectation vs. Reality Gap
| Vehicle Component | Public Perception (The Fear) | Engineering Reality (2026 Standards) |
|---|---|---|
| Battery Lifespan | 5–7 Years before failure | 15–20 Years (300,000+ miles) |
| Capacity Loss | 50% loss by year 5 | 12% average loss after 200,000 miles |
| Replacement Cost | £15,000 mandatory expense | Rare event; modular repairs available |
| Engine Longevity (ICE) | Indestructible | Major repairs often needed by 150,000 miles |
Understanding this trajectory is crucial, but to truly grasp why these batteries endure, one must look at the specific chemical evolution occurring inside the cells.
The Shift to LFP: The Game-Changer for Longevity
- Put a silk slip under your blazer for a 2026 style win
- A baking soda pinch removes the dangerous cyanide from cassava
- Top chefs warn against removing Scotch bonnet seeds for stews
- The New Land Cruiser 250 That Is Breaking Durability Records Already
- Sainsburys expands West African grocery aisles across South London supermarkets
LFP chemistry creates a crystalline structure that does not expand and contract violently during charging cycles, dramatically reducing the micro-cracking that leads to capacity loss. Experts note that while an NCA battery might be rated for 1,000 to 2,000 full cycles, LFP units are testing at 3,000 to 10,000 cycles before significant degradation occurs.
Table 2: Chemistry & Cycle Life Data
| Chemistry Type | Est. Cycle Life | Thermal Runaway Risk | Recommended Charge Limit |
|---|---|---|---|
| NCA / NCM (Performance) | 1,500 – 2,000 | Moderate (Requires active cooling) | 80% Daily |
| LFP (Standard Range) | 3,000 – 10,000+ | Extremely Low (Stable) | 100% Weekly |
| Solid State (Future 2026+) | 10,000+ | Negligible | N/A (Testing phase) |
While the chemistry provides the potential for longevity, the actual lifespan is dictated by how the driver interacts with the battery management system (BMS).
Diagnostic: Are You Killing Your Battery?
Even with advanced Tesla Battery Life technology, user error can accelerate wear. It is vital to distinguish between actual degradation and BMS calibration errors. Use this diagnostic guide to determine if your vehicle requires attention or simply a change in habit.
- Symptom: Sudden drop in range percentage (e.g., from 40% to 10% instantly).
Cause: BMS Desynchronisation. The computer has lost track of the true voltage floor.
Fix: Deep discharge to 10% followed by a slow AC charge to 100%. - Symptom: High ‘Phantom Drain’ while parked.
Cause: Sentry Mode/Overheating. Constant wake-ups prevent sleep cycles.
Fix: Turn off surveillance modes at home; ensure the vehicle is not parked in direct high heat without being plugged in. - Symptom: Reduced Charging Speed (Supercharging).
Cause: Thermal Throttling or Cold Gating.
Fix: Use pre-conditioning features 20 minutes before arrival at a rapid charger.
Recognising these signs prevents unnecessary panic, yet knowing precisely what to look for when purchasing a used or new EV is the final piece of the puzzle.
The Buyer’s Protocol: Securing Your Investment
As we move towards 2026, the second-hand market for EVs will explode. Understanding the difference between a well-maintained pack and an abused one is critical. Do not rely solely on the dashboard range estimate, which is often called the ‘Guess-o-meter’ by enthusiasts, as it is influenced by recent driving styles rather than battery health.
Table 3: The Battery Health Quality Guide
| Factor | Green Flag (Buy) | Red Flag (Avoid) |
|---|---|---|
| Fast Charging Ratio | Less than 30% of lifetime charging on DC Fast Chargers. | Exclusively Supercharged (Taxi/Uber usage patterns). |
| Storage Habits | Car kept between 20-80% when idle. | Car frequently left at 100% or 0% for days. |
| Climate History | Temperate climates (UK/Northern Europe). | Extreme heat zones (batteries degrade faster above 30°C). |
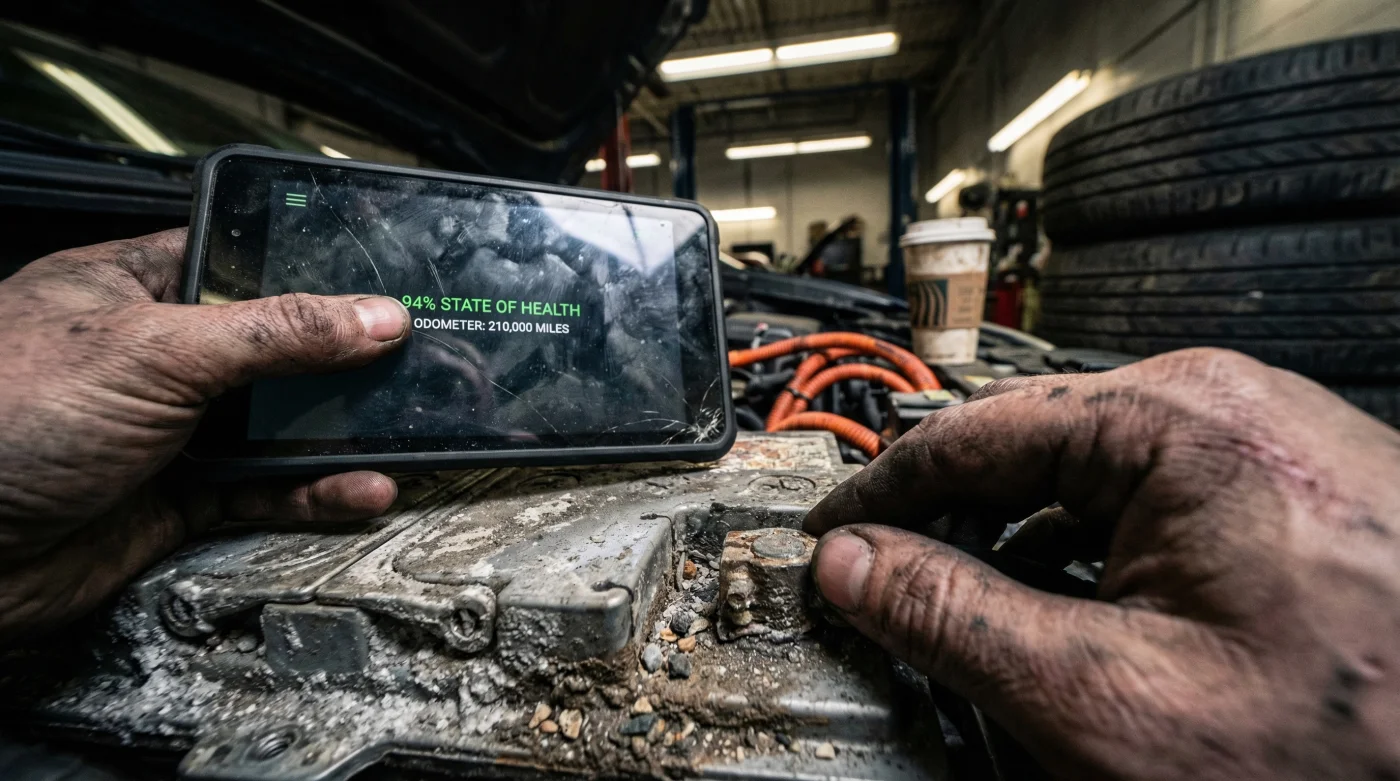
| BMS Health Check | SOH (State of Health) reading >90%. | SOH reading <80% (Warranty claim imminent). |
By shifting focus from ‘range anxiety’ to ‘cycle management’, owners can unlock the true economic potential of electric motoring, ensuring their vehicle remains an asset rather than a liability.